Preview
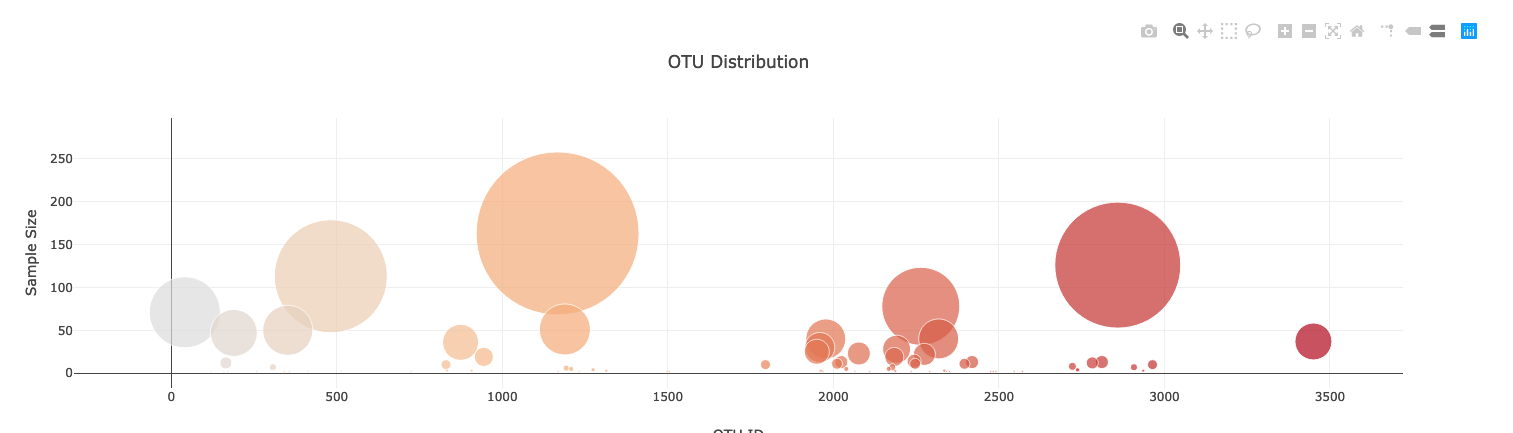
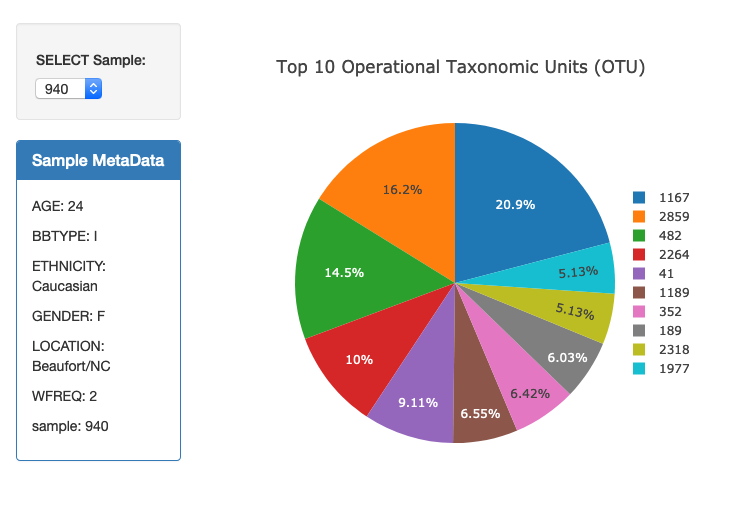
Metadata menu and data visualization
Challenge
Build a web based virtual environment to host, respond and update visualizations of biomedical data.
Methodology
Used Pandas and Numpy to create SQLalchemy engine and map data to menu selection. When users select a menu choice, multiple charts and tables are simultaneously updated with Flask routing and visualized with Plotly. Final product deployed through a virtual environment on Heroku App.