Temperature
Latitude and Temperature Comparisons
Challenge
Gather data from the Open Weather API and visualize information for 500+ cities of varying distance from the equator. Analyze and visualize differences in temperature, humidity, cloudiness and wind speed.
Methodology
Created and implemented API keys to gather data. Created randomized selection process within range of framework. Applied try and except looping to check validity of data. Used python to read JSON responses, to sort information into dataframes, and export as stabilized CSVs. Visualized information using Seaborn and exported images for report.
Analysis
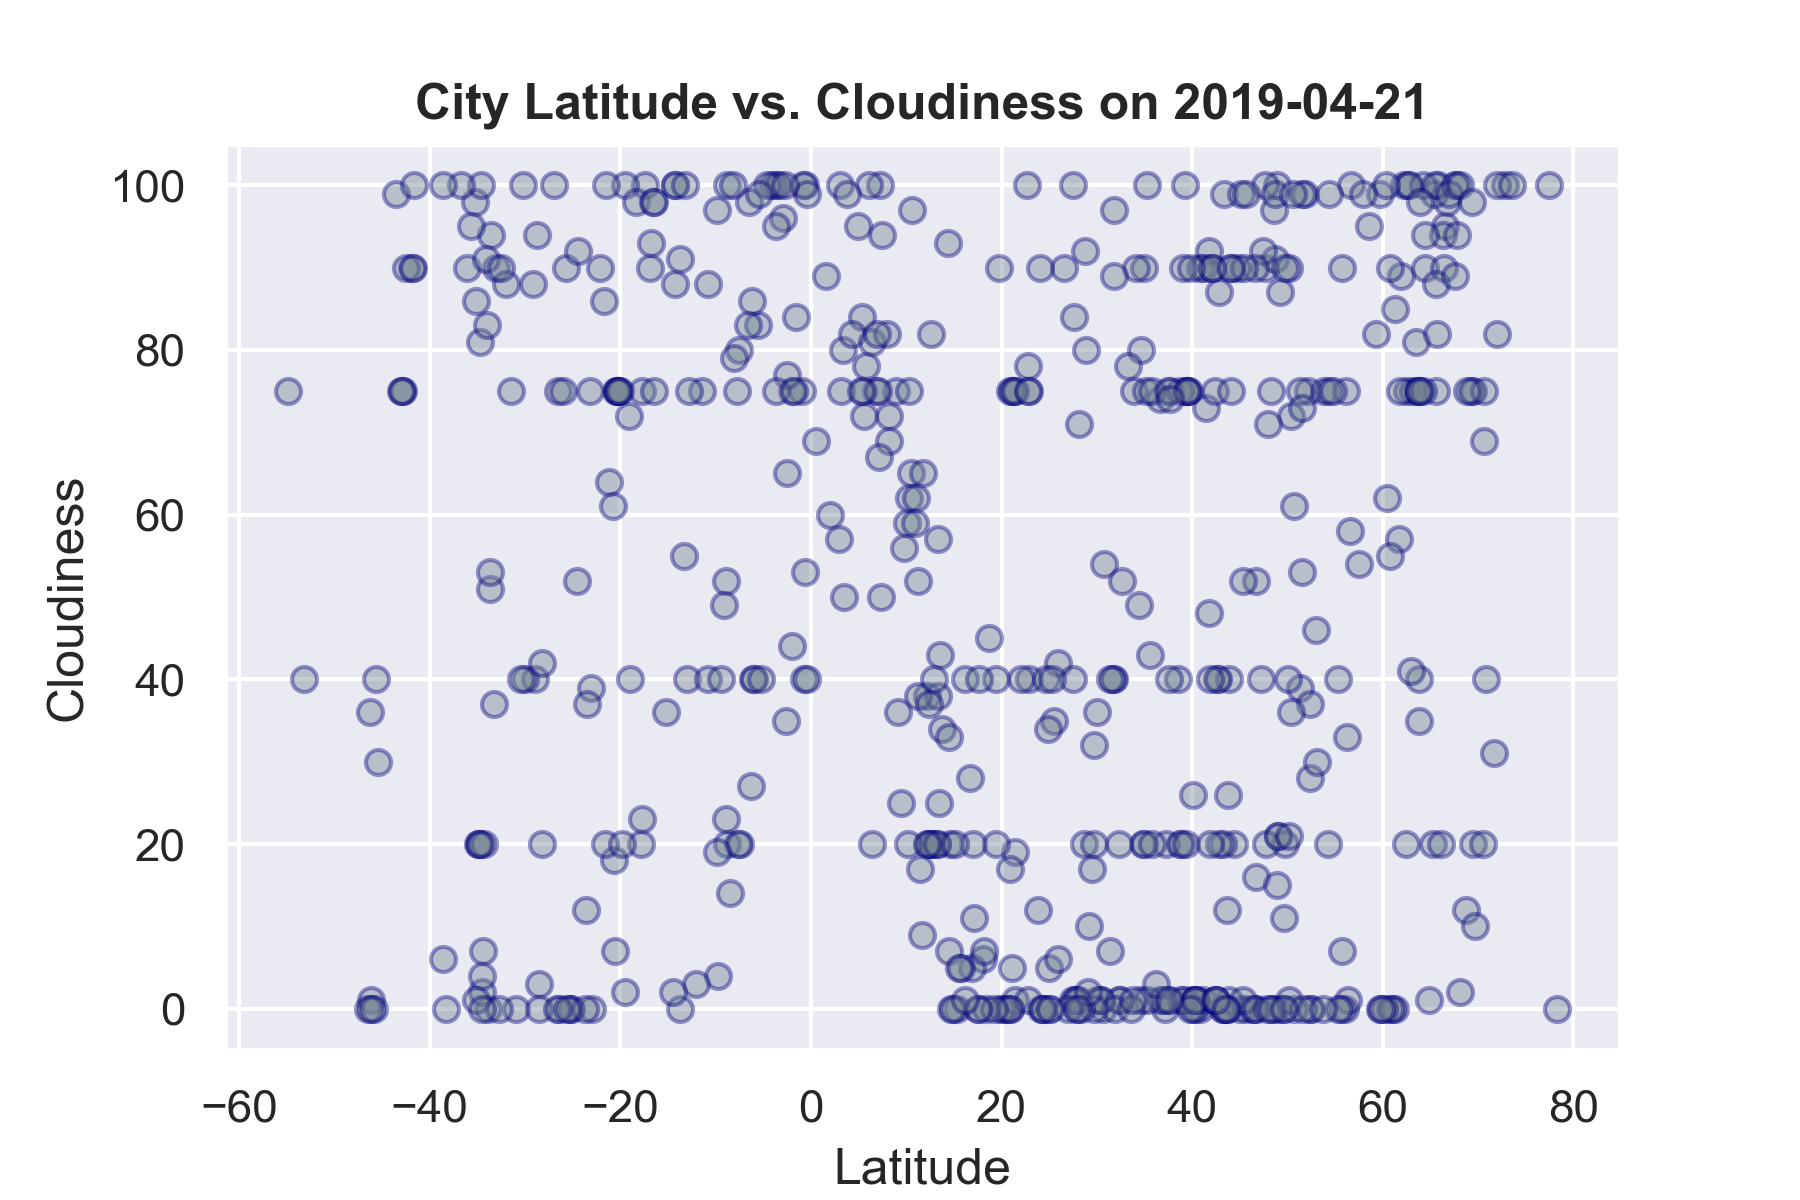
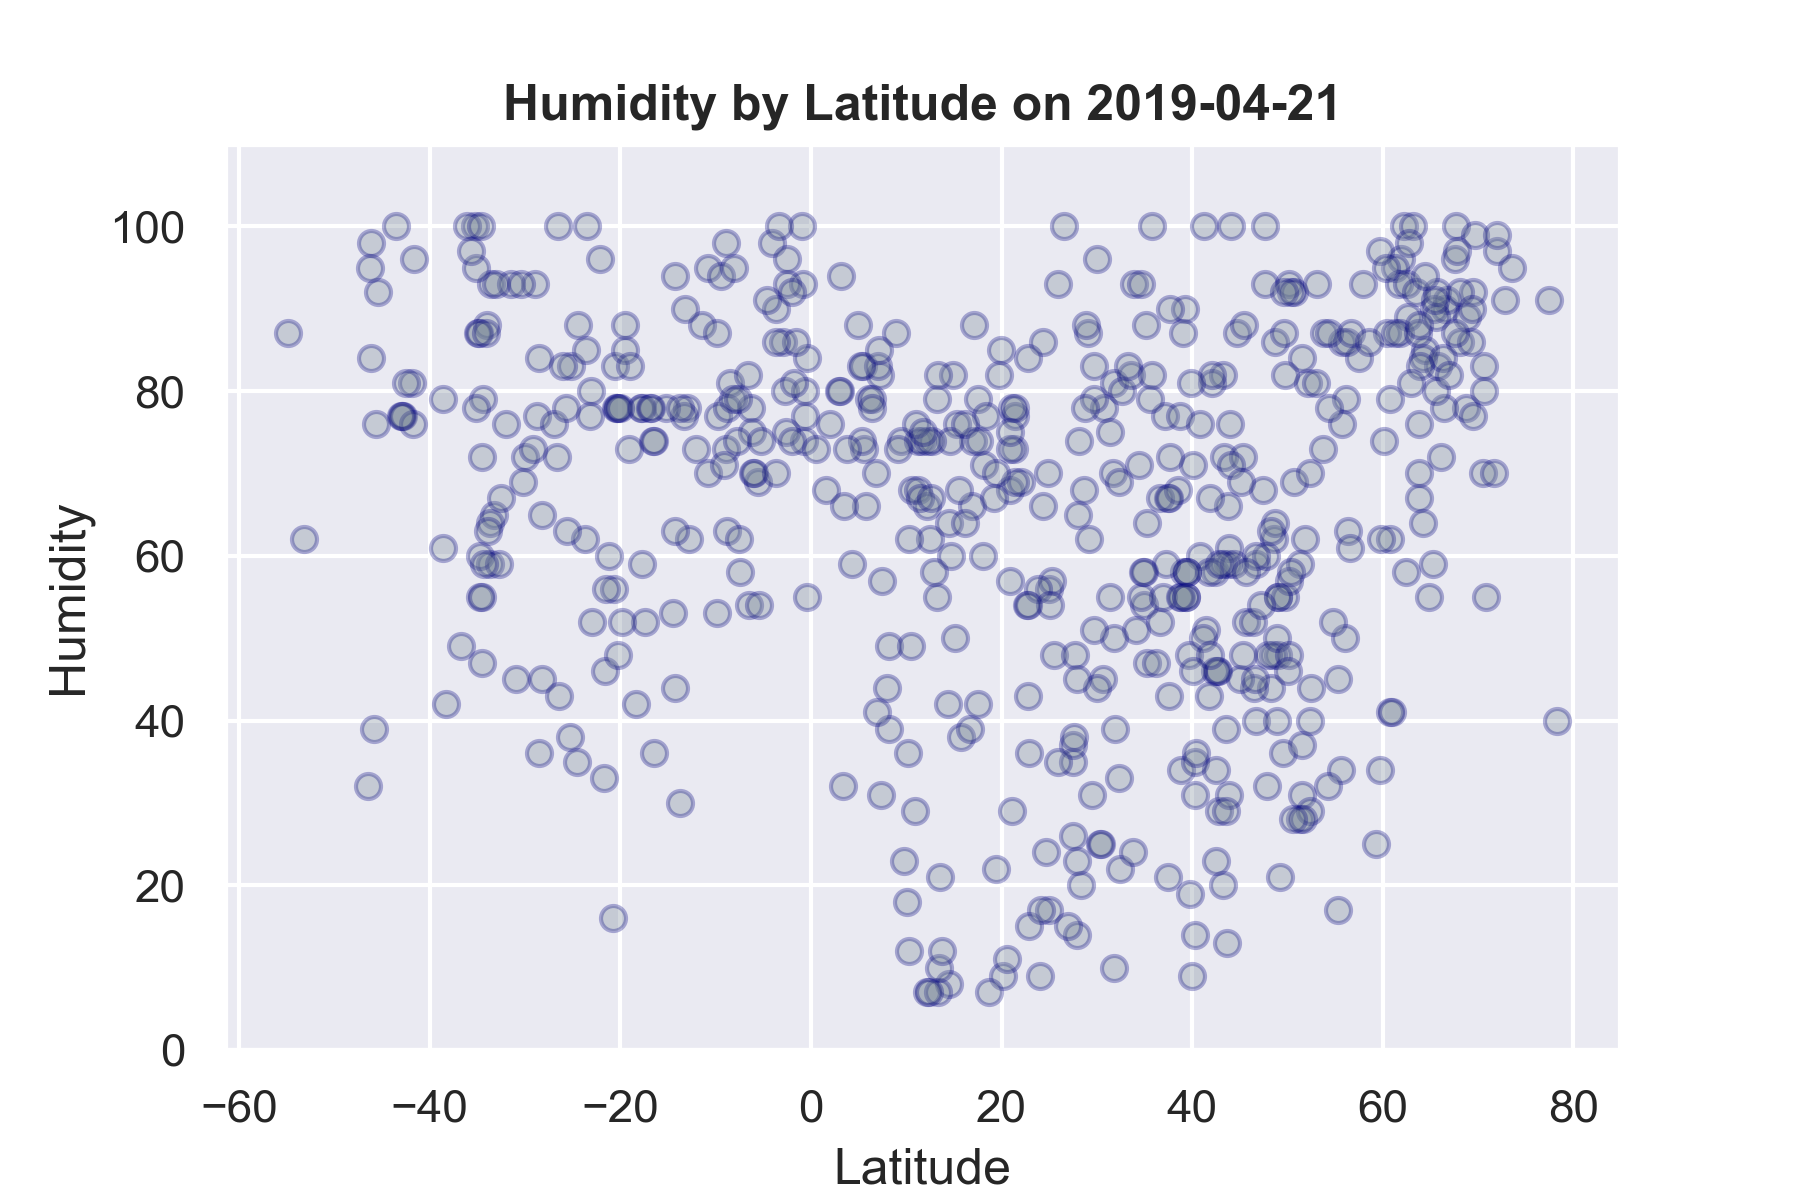
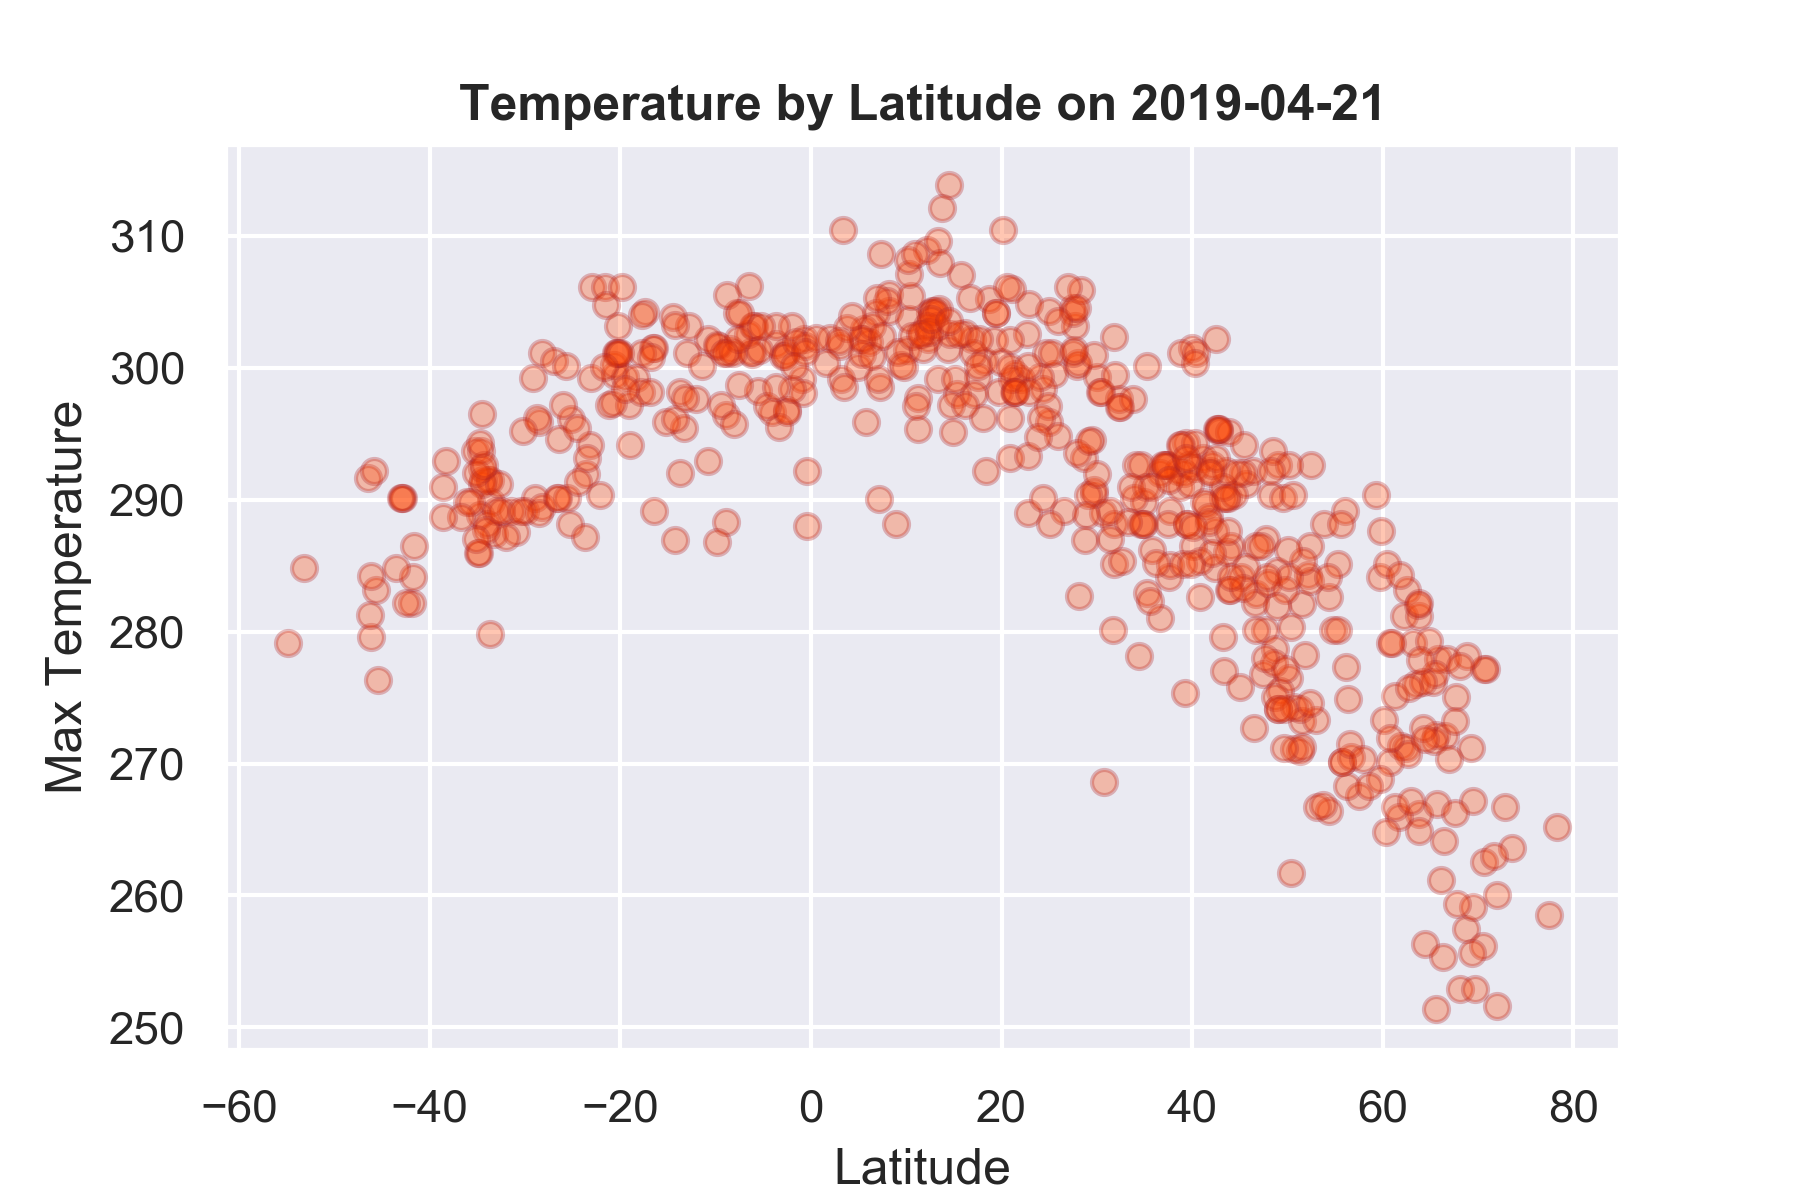
As expected, the weather becomes significantly warmer as one approaches the equator (0 Deg. Latitude). More interestingly, however, is the fact that the southern hemisphere tends to be warmer this in the Spring season than the northern hemisphere. This could be due to the tilt of the earth. In terms of cloud coverage, there are no clear city differentiation of the cloud patterns tend to aggregate at 0, 80, and 100% coverage. There are no strong relationships between latitude and wind speed. However, in northern hemispheres there is a flurry of cities with over 20 mph of wind.